
I-B) Exploratory Data Analysis
Analysis on original signal (Orig2.wav)
Source code:
% Read sound files
% 'signal' is the vector holding the original
samples &
% 'freq' refers to the sampling frequency
[signal,freq]=wavread('orig2.wav');
n= length(signal);
%plot original signal in frequency domain
figure;
plot((1:n)/freq,signal);
title('Original signal in time domain');
xlabel('second');
grid;
% remove DC component
% Use fast fourier Transform to
% transform the original signal
% into frequency domain.
figure;
signal0=signal-mean(signal);
fsignal=fft(signal0);
plot((1:n/2)/n*freq,abs(fsignal(1:n/2)));
title('Original signal in frequency domain');
xlabel('Hz');
ylabel('magnitude');
grid;
figure;
plot((1:n/2)/n*freq,unwrap(angle(fsignal(1:n/2))));
title('Original signal in frequency domain');
xlabel('Hz');
ylabel('phase');
grid;
![]()
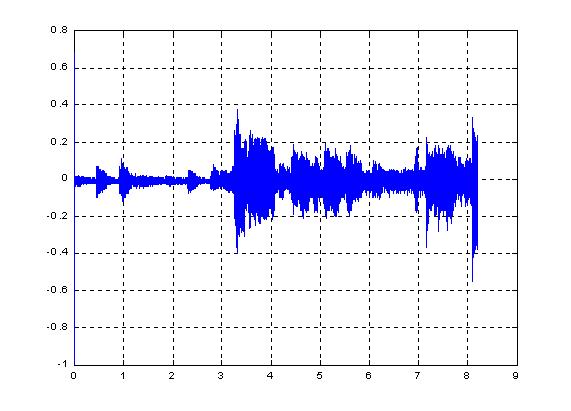
Figure 1: Original signal is time domain
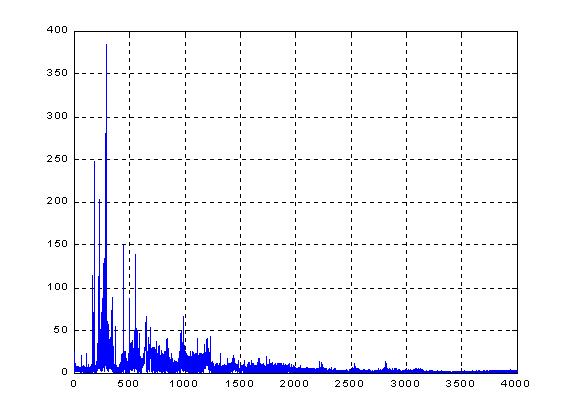
Figure 2: Original signal is frequency domain
Analysis on noisy signal (noisy2.wav)
Source Code:
% Read sound files
% 'signal' is the vector holding the original samples &
% 'freq' refers to the sampling frequency
[signal,freq]=wavread('noisy2.wav');
n= length(signal);
%plot noisy signal in frequency domain
figure;
plot((1:n)/freq,signal);
title('Noisy signal in time domain');
xlabel('second');
grid;
% Use fast fourier Transform to
% transform the original signal
%into frequency domain
figure;
signal0=signal-mean(signal); % remove DC component
fsignal=fft(signal0);
plot((1:n/2)/n*freq,abs(fsignal(1:n/2)));
title('Noisy signal in frequency domain');
xlabel('Hz');
ylabel('magnitude');
grid;
figure;
plot((1:n/2)/n*freq,unwrap(angle(fsignal(1:n/2))));
title('Noisy signal in frequency domain');
xlabel('Hz');
ylabel('phase');
grid;
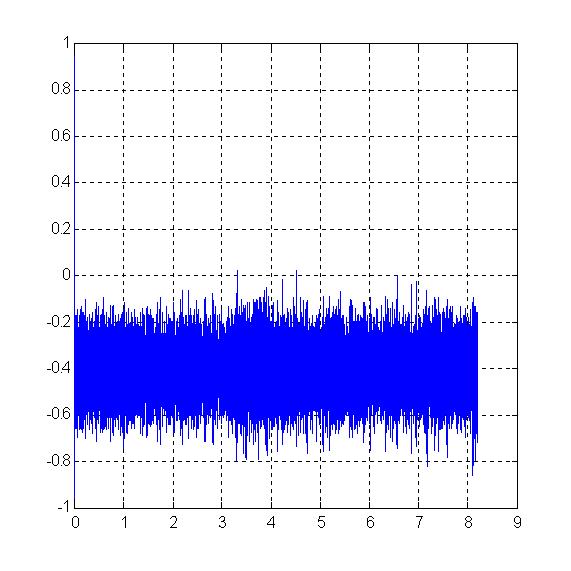
Figure 4: Noisy signal is time domain
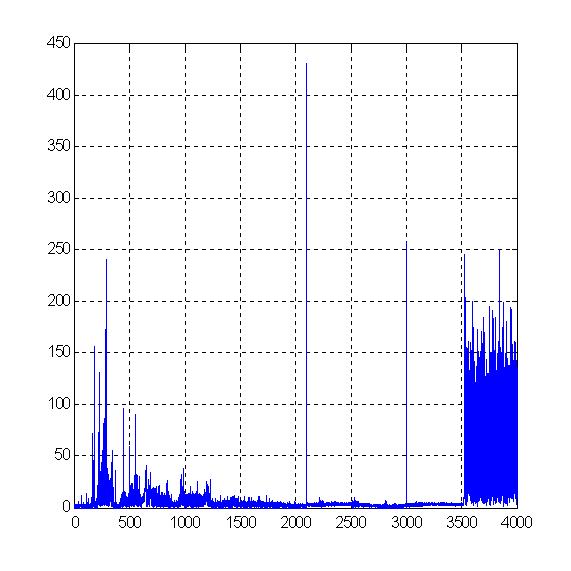
Figure 5: Noisy signal is frequency domain
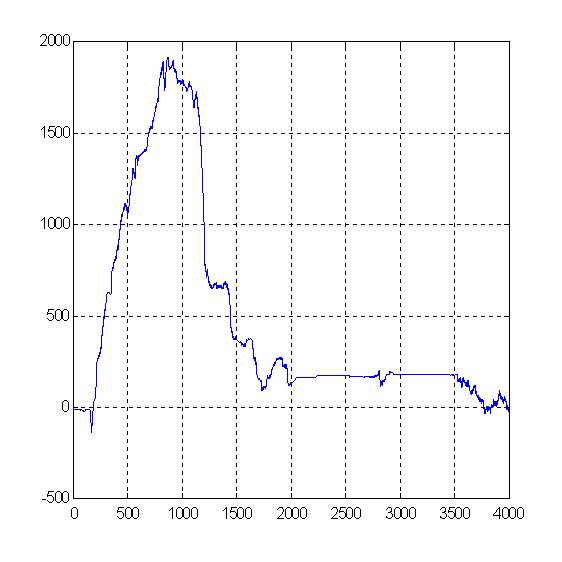
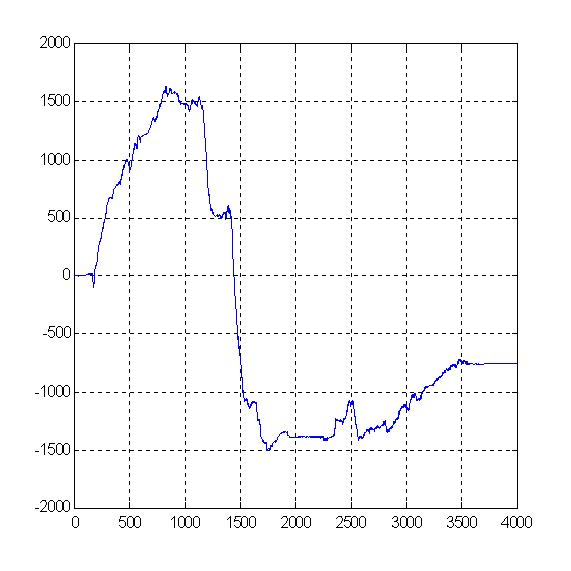
Figure 6: Noisy signal(Phase) in frequency domain
Observation and Eleboration
Figure 1,2,3 show the characteristic of Original
Signal (orig2.wav) in time domain and frequency domain respectively
whereas Figure 4,5,6 show the characteristic of the Noisy Signal (noisy2.wav)
in time domain and frequency domain.
By observation, we see that most of the signal of the orig2.wav is
contained below a frequency of 1500hz, signal above 200hz is neglegible.
On the other hand, for noisy2.wav,its time domain is chaos and very difficult
to determine, whereas its frequency domain give clear image on it's characteristis,
this is the advantages on using frequency domain. for frequency below 1500hz,
the content is identical with the orig2.wav but frequency above give addition
information, this is the distortion noise of the signal. Its distortion
will be remove by using filter command in next session.
Design and Implementation of Lowpass FIR Filters
Source Code:
ft=8000;
% obtained from n=length(noise)
fp=1500;
fs=2000;
% Taken from figure 2 and figure 4
fc=(fp+fs)/2;
wn=(fp+fs)/ft;
n=40;
bbb=fir1(n,wn);
% find out the impulse response
% of the FIR Filter
figure;
stem(bbb);
% Plot the impulse response of FIR filter
nbits=6;
% Quantization bit
quantized=zeros(1,n);
for i=1:(n+1)
quantized(i)=[bbb(i)*2^(nbits-1)+0.5]/(2^(nbits-1));
end
figure;
stem(quantized);
% Plot the quantized implused response
[noise,freq]=wavread('noisy2.wav');
n=length(noise);
%length of the original signal
signal=filter(quantized,1,noise);
sound(signal);
% To play the filtered noisy2.wav file
wavwrite(signal,'filtered.wav');
% Save the filtered signal as filtered.wav
origin=wavread('orig2.wav');
% calculate the MSE
total=0;
m=65536;% obtained from n (number of sample)
for i=1:m
res=(signal(i)-origin(i))^2;
total=total+res;
end
mse=(1/m)*total
tot2=0;
% calculate the SNR
for i=1:m
tot2=tot2+origin(i)^2;
end
total2=(1/m)*tot2;
snr=10*log10(total2/mse)
tot3=0;
%SNR
for i=1:m
tot3=tot3+signal(i)^2;
end
total3=(1/m)*tot3;
snr=10*log10(total3/mse)
% plot original signal in time domain;
figure;
subplot(2,1,1);
plot((1:n)/freq,signal);
title('Filtered signal in time domain');
xlabel('second');
grid;
subplot(2,1,2);
plot((1:n)/freq,origin);
title('Original signal in time domain');
xlabel('second');
grid;
% plot original signal in frequency domain.,
figure;
signal0=signal-mean(signal);
fsignal=fft(signal0);
origin0=origin-mean(origin);
forigin=fft(origin0);
subplot(2,1,1);
plot((1:n/2)/n*freq,abs(fsignal(1:n/2)));
title('Filtered signal in frequency domain');
xlabel('Hz');
ylabel('magnitude');
grid;
subplot(2,1,2);
plot((1:n/2)/n*freq,abs(forigin(1:n/2)));
title('Original signal in frequency domain');
xlabel('Hz');
ylabel('magnitude');
grid;
figure;
subplot(2,1,1);
plot((1:n/2)/n*freq,unwrap(angle(fsignal(1:n/2))));
%use help command to learn about unwarp function
title('Filtered signal in frequency domain');
xlabel('Hz');
ylabel('phase');
grid;
subplot(2,1,2);
plot((1:n/2)/n*freq,unwrap(angle(forigin(1:n/2))));
%use help command to learn about unwarp function
title('Original signal in frequency domain');
xlabel('Hz');
ylabel('phase');
grid;
![]()
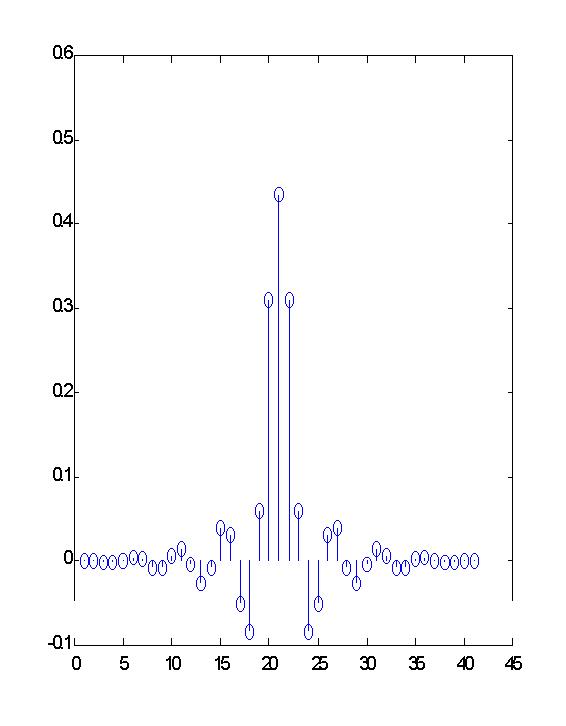
Figure7: Impulse response of FIR filter
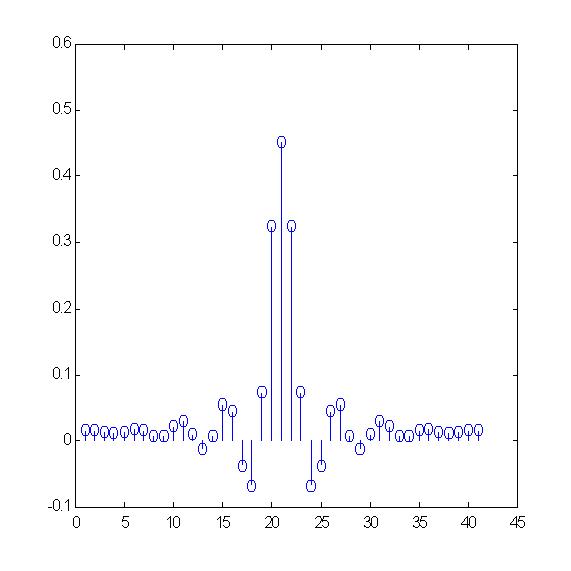
Figure 8: Impulse response(quantized) of FIR filter
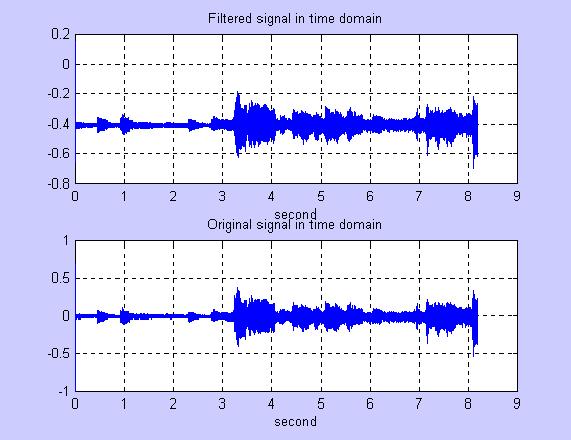
Figure 9: Original signal Vs Filtered signal (time domain)
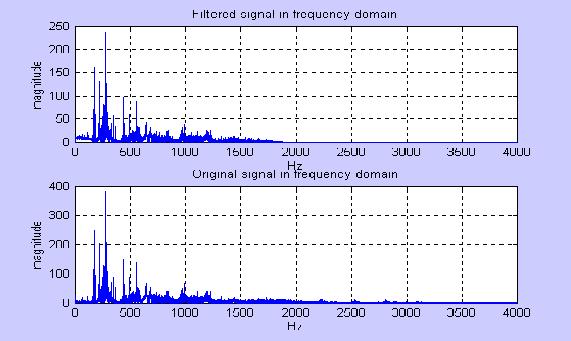
Figure 10: Original signal Vs Filter signal ( frequency domain)
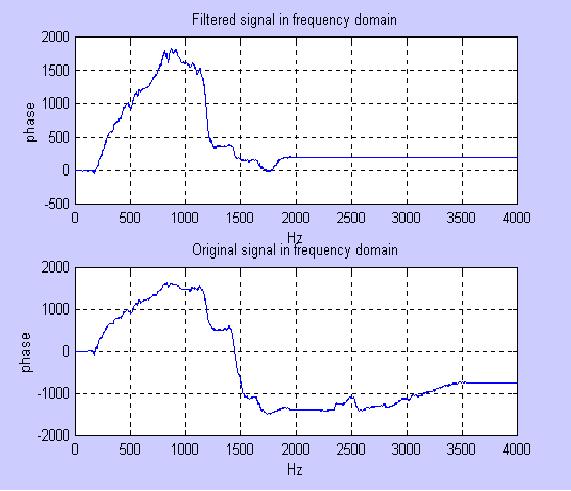
Figure 11: Original signal Vs Filtered signal (frequency[phase] domain)
MSE & SNR results:
MSE : 0.1643
SNR(Filtered): 17.3400
SNR(Original): 0.0663
The filtered signal: filtered.wav
Observation and Comments
i) comparison of impulse response (Original vs Quantized0
a) The value has commonly shifted upwards and
the output noise is blur.
b) By adding up another Quantization bit to 6,
the result increase much
c) Stick to 6 quantization bit in the following
experiment.
ii) Comparison between Original signal and Filtered signal
a) Most of the contents of the orig2.wav
is kept,since the signal above 1500hz consist of unwanted noise, signal
above 1500 hz is filtered.
b) The final output effect is satisfied
and fairly close to the original signal. orig2.wav. Whereas for the frequency[phase]
domain, we can see that it has a shift of phase in the filtered signal.
![]()
![]()
![]()