Butterworth Lowpass IIR Filter Design
Source Code:
Wp=1500/4000;
% normalised passband frequency
Ws=2000/4000;
% normalised stopband frequency
Rp=0.03;
Rs=40;
[N,Wn]=buttord(Wp,Ws,Rp,Rs);
[num,den]=butter(N,Wn);
% computer the nominator and
% denominator of impulse response
[aaa,freq]=wavread('noisy2.wav');
n=length(aaa);
%length of the original signal
signal=filter(num,den,aaa);
%generate the filtered signal
% plot original signal in time domain;
figure;
plot((1:n)/freq,signal);
title('Original signal in time domain');
xlabel('second');
grid;
% plot original signal in frequency domain.,
figure;
signal0=signal-mean(signal);
fsignal=fft(signal0);
plot((1:n/2)/n*freq,abs(fsignal(1:n/2)));
title('Original signal in frequency domain');
xlabel('Hz');
ylabel('magnitude');
grid;
figure;
plot((1:n/2)/n*freq,unwrap(angle(fsignal(1:n/2))));
%use help command to learn about unwarp function
title('original signal in frequency domain');
xlabel('Hz');
ylabel('phase');
grid;
origin=wavread('orig2.wav');
% calculate the MSE
total=0;
m=65536;% obtained from n (number of sample)
for i=1:m
res=(signal(i)-origin(i))^2;
total=total+res;
end
mse=(1/m)*total % MSE of filtered signal
tot2=0;
% calculate the SNR
for i=1:m
tot2=tot2+origin(i)^2;
end
total2=(1/m)*tot2;
snr=10*log10(total2/mse) %SNR of filtered signal
tot3=0;
%SNR
for i=1:m
tot3=tot3+signal(i)^2;
end
total3=(1/m)*tot3;
snr=10*log10(total3/mse) % SNR of original signal
![]()
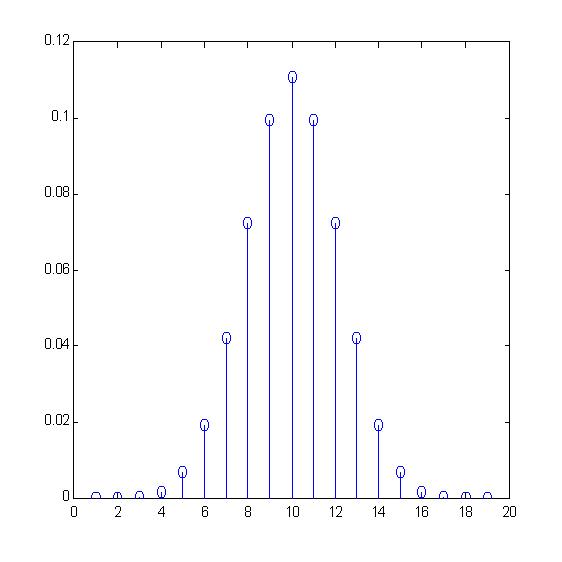
Figure 1: Numerator
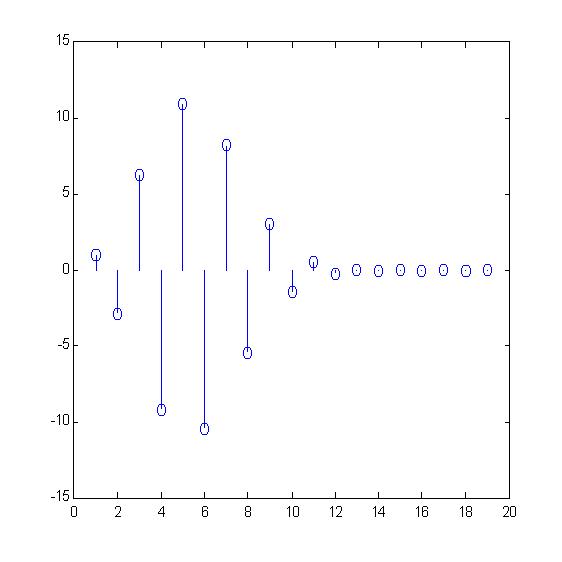
Figure 2: Denominator
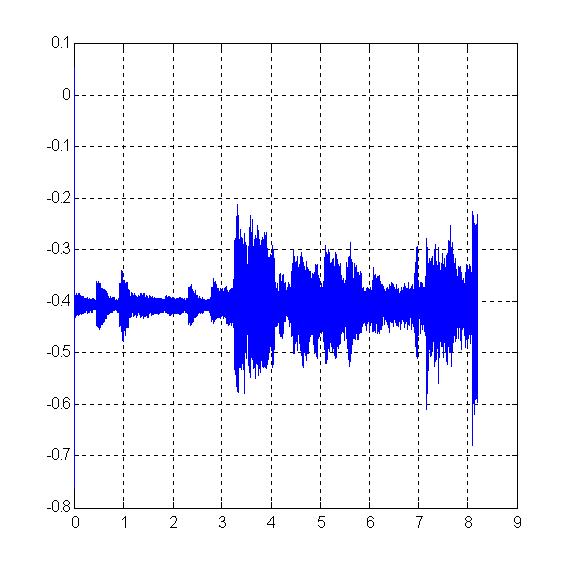
Figure 3: Filtered signal in time domain
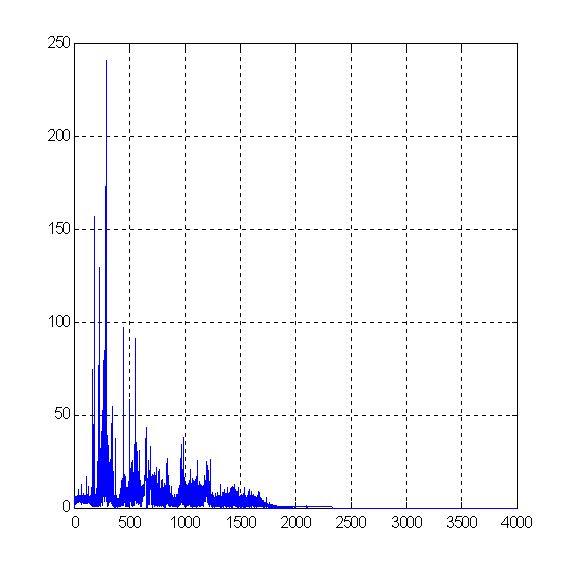
Figure 4: Filtered signal in frequency domain
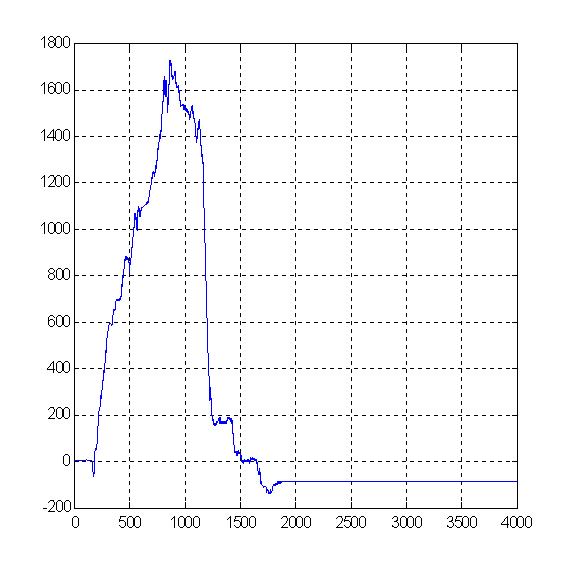
Figure 5: Filtered signal(phase) in frequency domain
SNR & MSE results:
MSE
:0.1635
SNR(Filtered)
:17.3184
SNR(Original) :0.089
Observation and Elaboration
Figure 1 and figure 2 show the series of numerator
and denominator of the IIR filter impulse response.
whereas figure 3 to 5 show the characteristic
of the filtered signal. the figures show that from the frequency range
1700 hz onwards, all of the signal is cutted down because signal above
this range are all noise, cutting down these part will get rid of the noise
at the same time maintain the content of the original signal (Orig2.wav).
Besides, the characteristic of signal
in time domain is closer to the original time domain signal compare with
the one obtained in FIR filter design, this show that the IIR filter
design give a bette performance than the FIR filter design.
![]()
![]()
![]()